Local elections – what is local about domestic violence?

As we approach local elections in England and Wales on 2nd May 2024, local and national politicians are setting the priorities for local authorities: for the funding they receive and spend – and the services they spend it on.

Where are responses to domestic violence and abuse in these priorities?

With many local authorities struggling to cover their statutory duties, such as social care and child protection, and facing loud criticism over bin collections and potholes, where do domestic abuse services fit into their plans?

These plans matter – from advice and information services, to specialist refuges and accommodation: all these are services that national government has devolved to local decision-making.

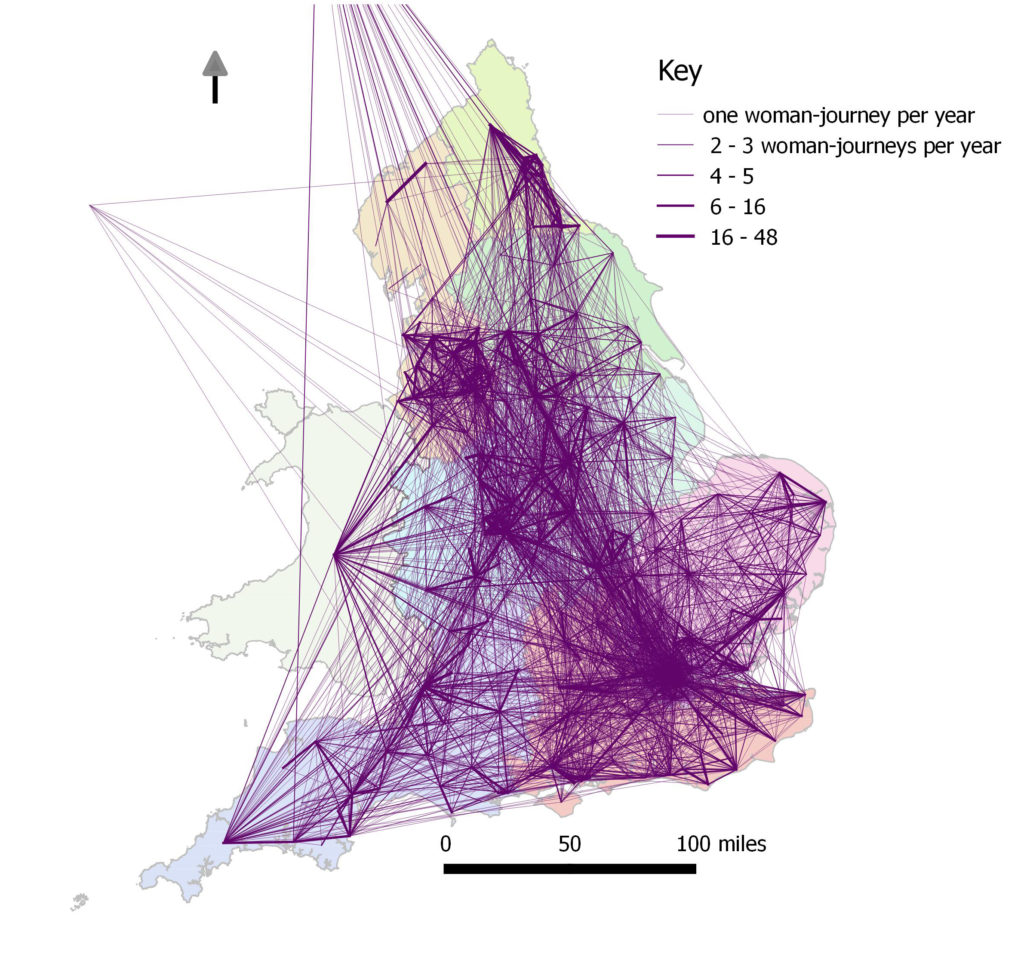
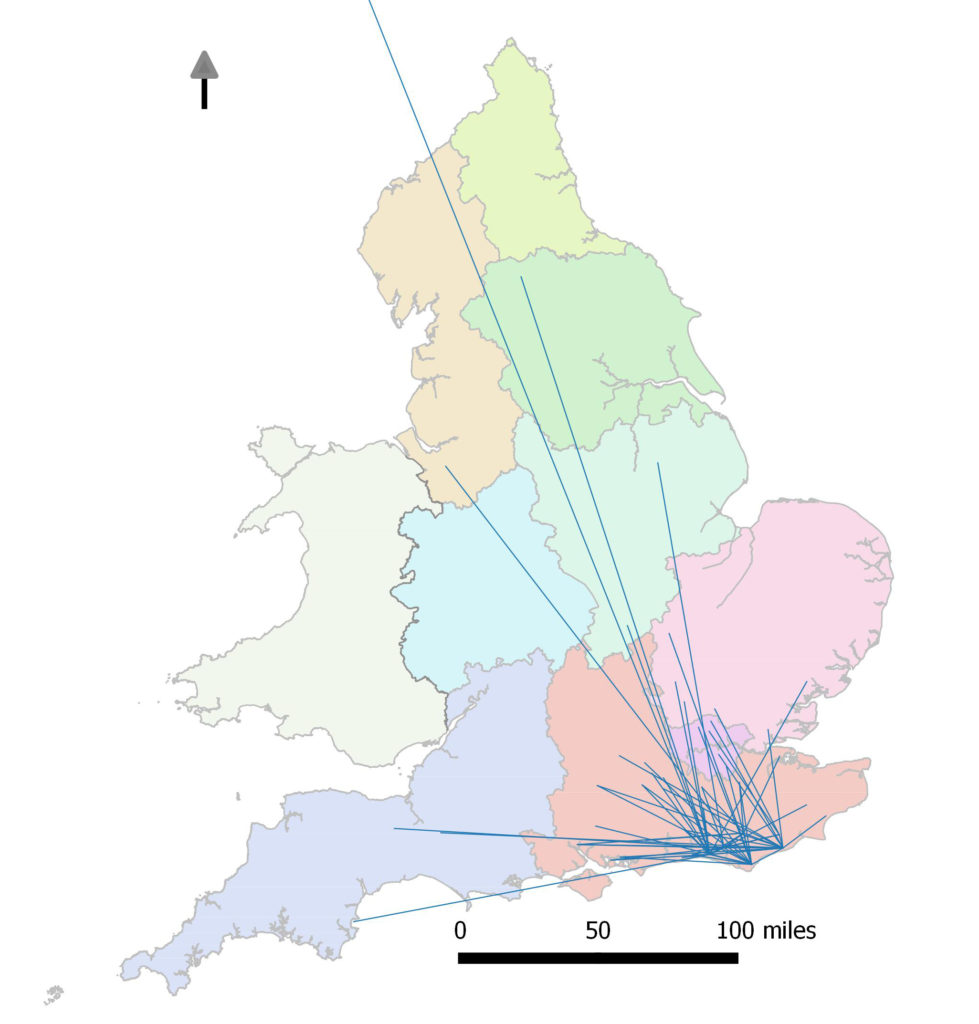
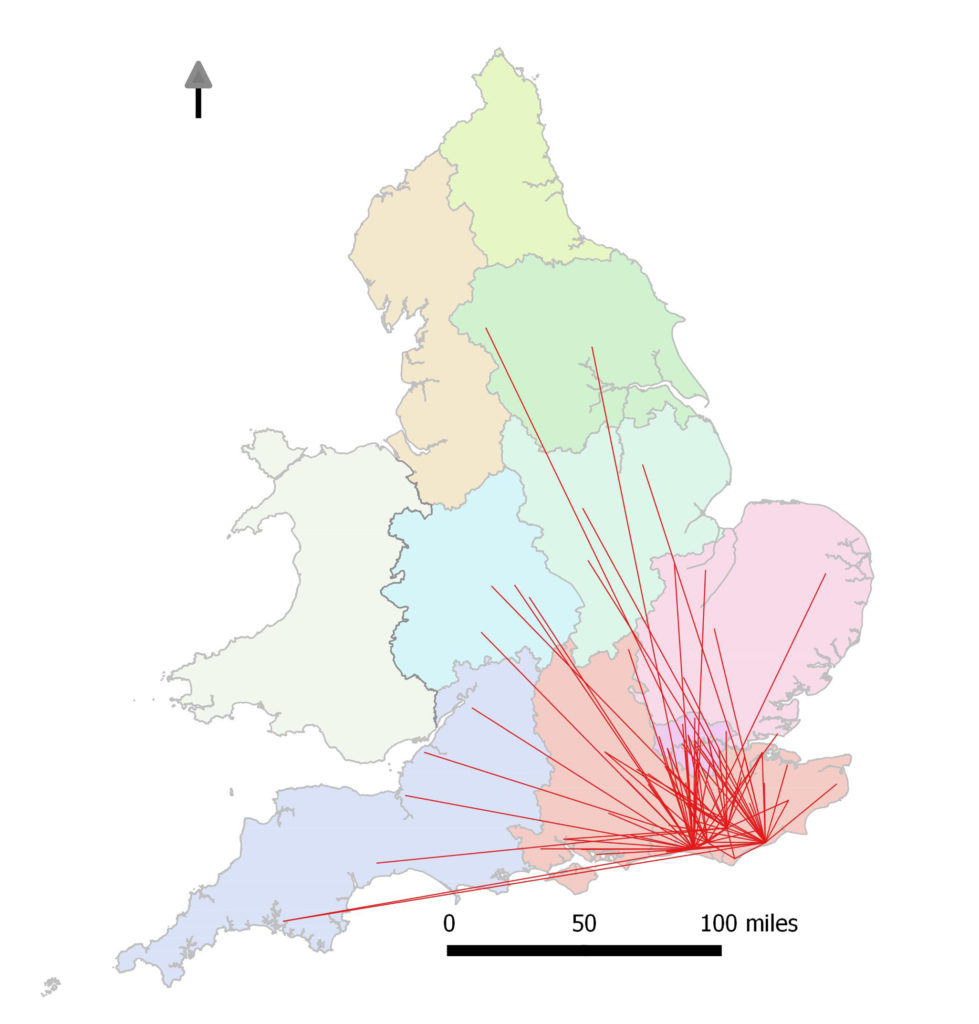
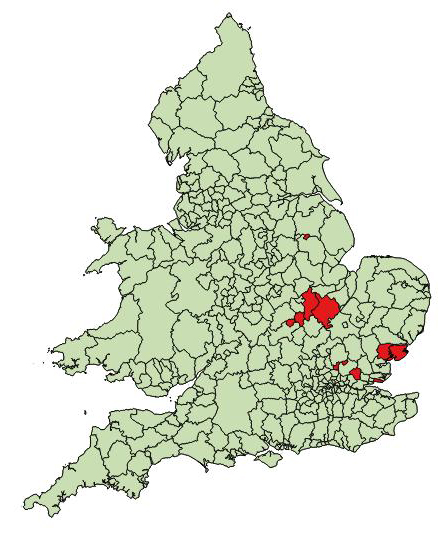
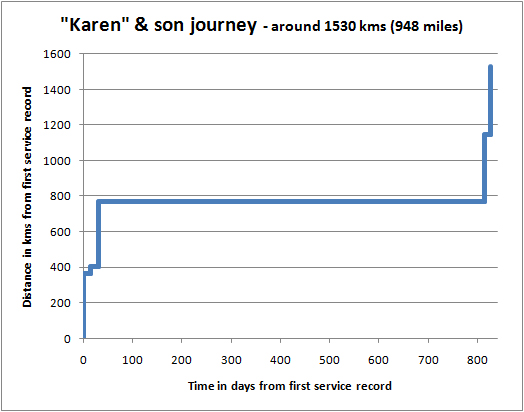
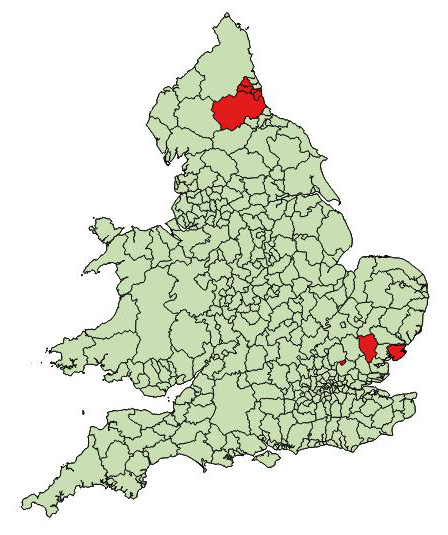
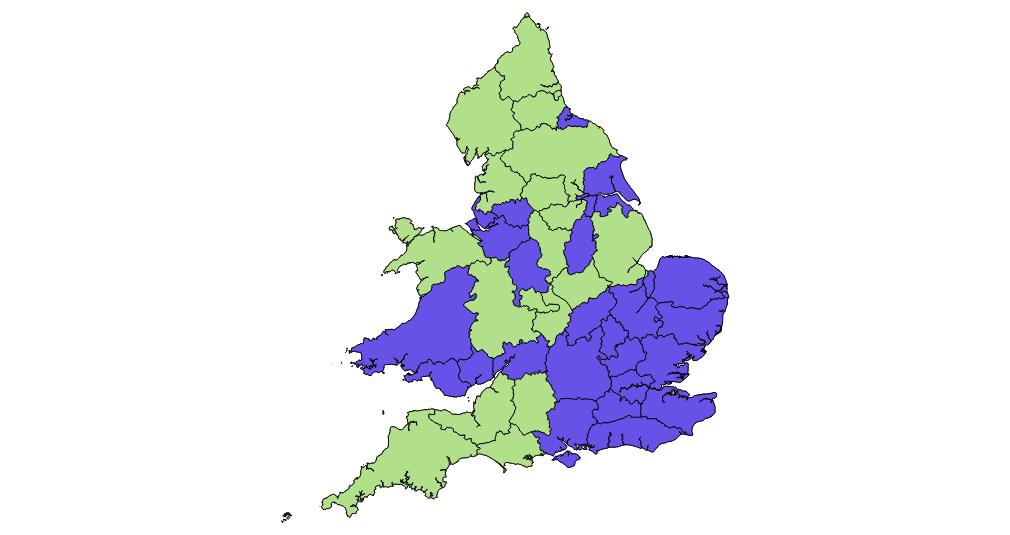
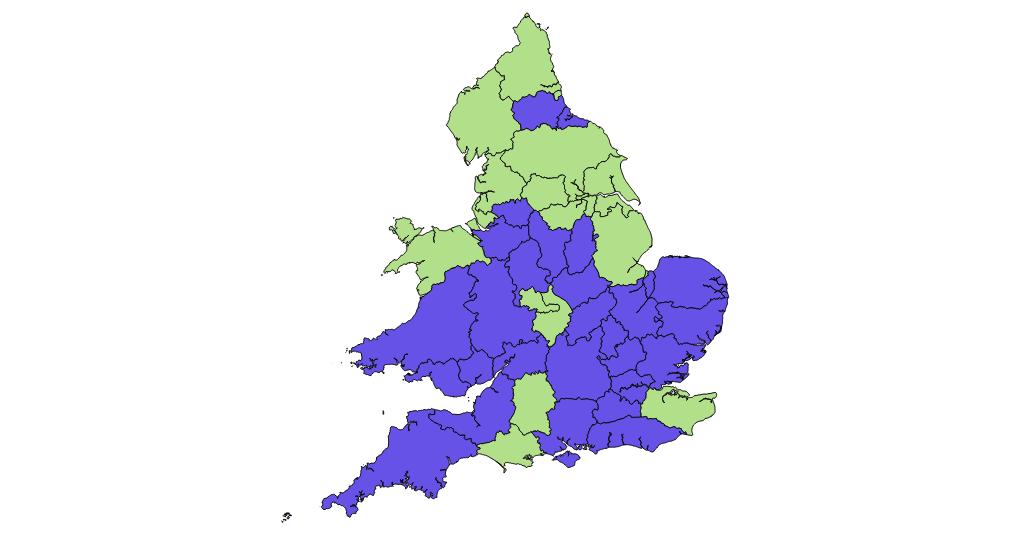
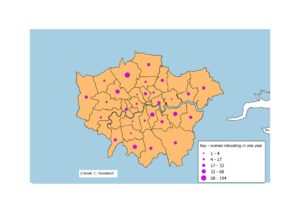
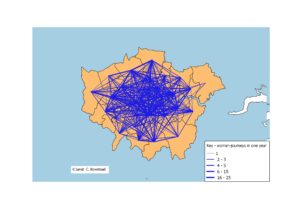
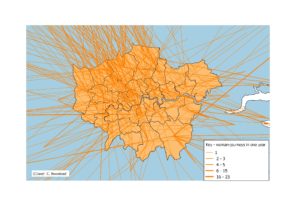
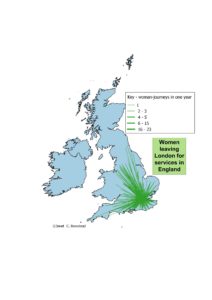
But domestic violence and abuse isn’t local. Not only are men violent and abusive to their women partners in every local authority in the country… but, to escape that threat, many women and children cross local authority boundaries to seek help and support – as well as safety.

The maps show the domestic violence journeys in one year to services for just five cities, as women (often with children) travel to or from Manchester, Newcastle, Plymouth, Southampton and Birmingham. They show women having to leave their local authority to get the help they need.

One year of domestic violence journeys to and from Manchester to services
One year of domestic violence journeys to and from Newcastle upon Tyne to services
One year of domestic violence journeys to and from Plymouth to services
One year of domestic violence journeys to and from Southampton to services
One year of domestic violence journeys to and from Birmingham to services

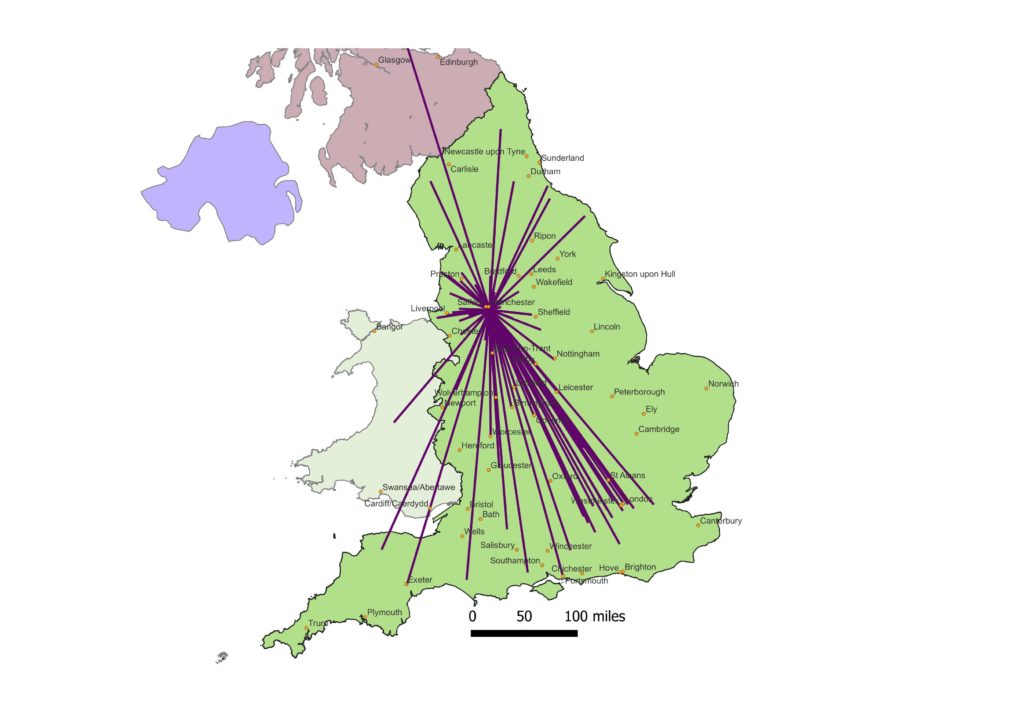
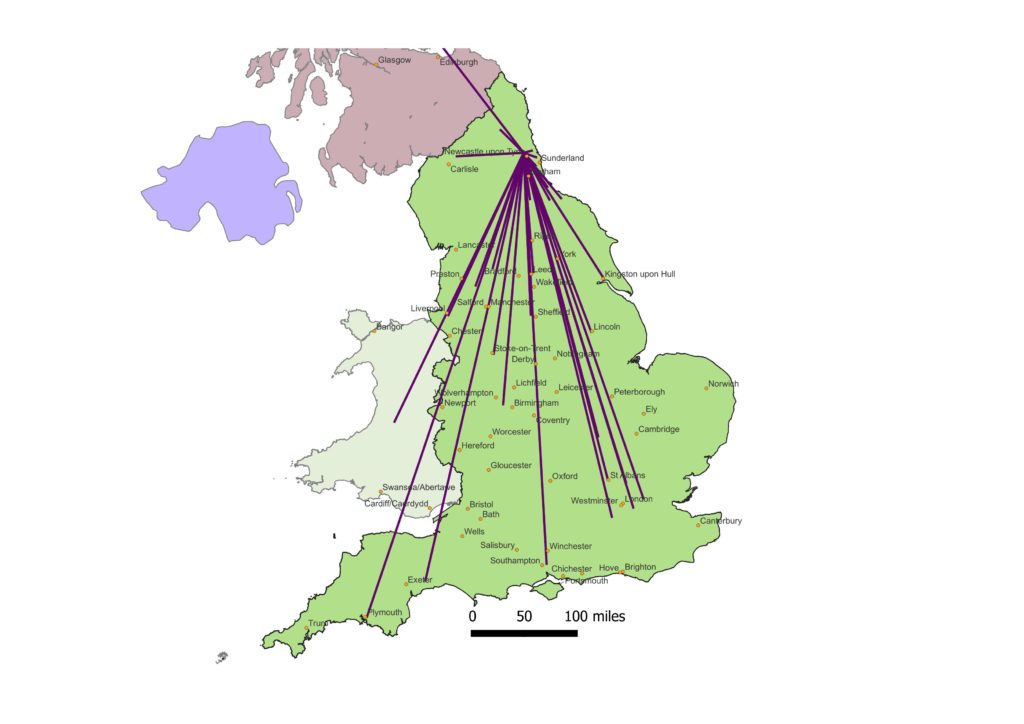
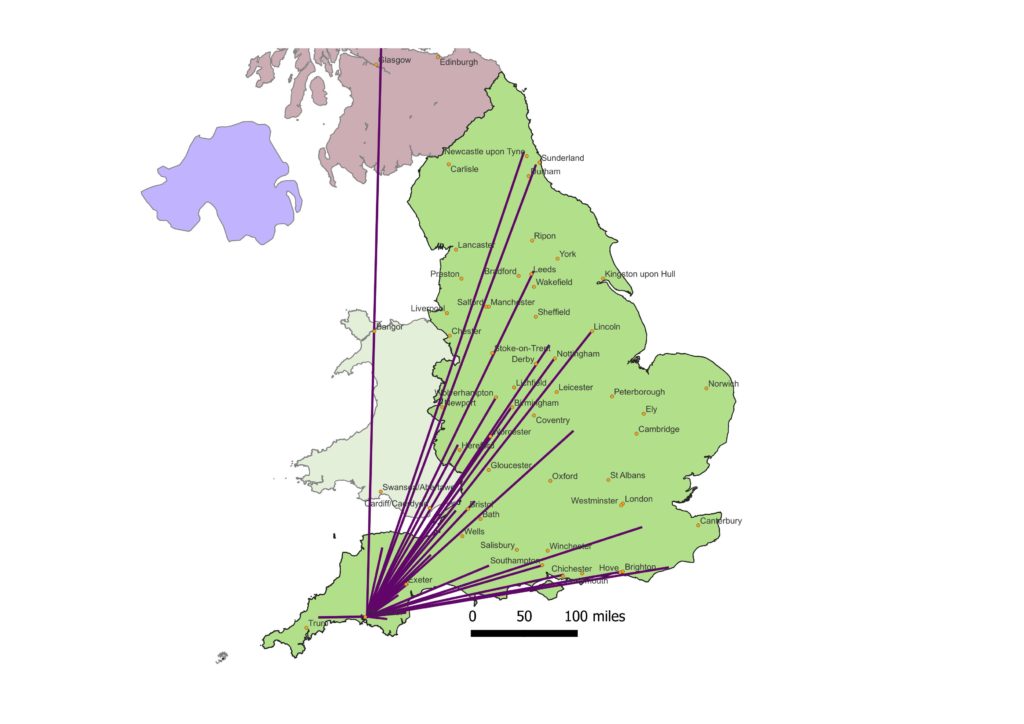
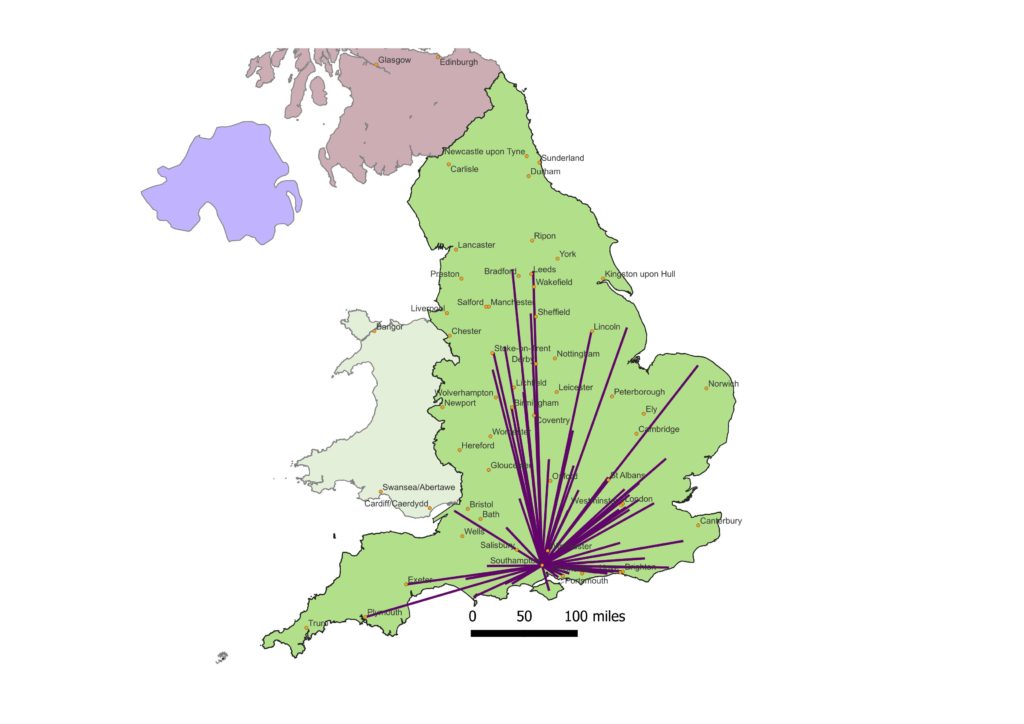
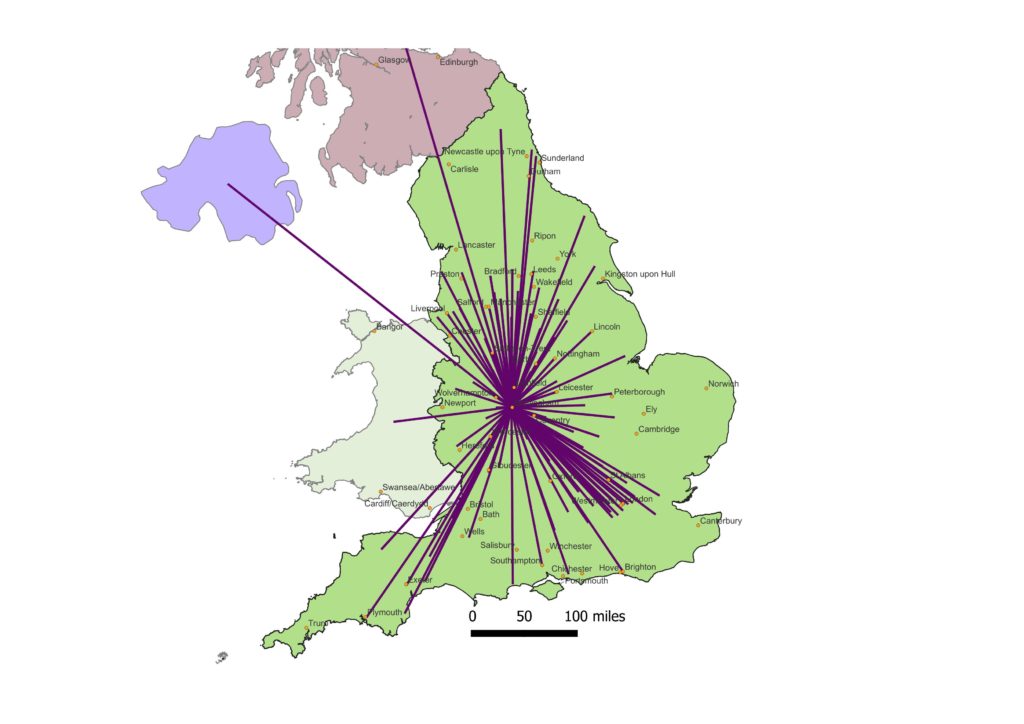
But women and children can only make such journeys if the services exist.

Local politicians may pledge to fund – or to cut funds to – domestic violence services, as part of seeking votes in the May elections. It’s a patchwork of separate – unconnected – decisions. And decisions that do not only affect local voters – but affect the tens of thousands of women and children who end up needing services somewhere else – not in their original local area.

It’s an ongoing mismatch between the scale of need and the scale of response – further cemented in the Domestic Abuse Act 2021.

We need services everywhere, because perpetrators are abusive to their partners or ex-partners everywhere; but we need a network across the whole country – not at risk from hundreds of separate local cuts and local priorities.

Counter-mapping for new knowledge

Creative geographies think critically about representation – what is shown and not shown. New visualisations allow new interpretations, new imaginings, new knowledge – to enable new worlds.

The aim is to counteract the dominant images – the dominant stories – as forms of social and political resistance.

Maps can be an especially powerful method of representation – and misrepresentation – and counter-mapping challenges the misrepresentation, the misinterpretation, and the previously and deliberately hidden geographies.

The new issue of “You Are Here: the journal of creative geography” focuses on counter/cartographies – highlighting that “Any act of map-making (conceptual, physical, material, or visual) is about relations of power and to countermap is to redistribute or reclaim power. It’s a practice that considers power at different scales, as it appears in different modes, represented in different places, as it occurs at different times, and perceived through different ways of knowing.”

Chapters include indigenous and activist mapping – claiming place, space and identity – questioning who makes the maps and who tells the stories that define our world.

Counter/cartographies is organised around four themed sections: boundaries, borders & place; counter-mapping & storywork; technology & information; and land & environment.

In the Countermapping and Storywork section, there are contributions to trouble and rework dominant cartographies – including a chapter[1] on this research: rendering visible the displacement journeys of women and children escaping domestic violence. In the United Kingdom, the dominant policy and practice story focuses on domestic violence rooted in place – with statutory duties only within local authority boundaries – and ignores the tens of thousands of women and children forced across those boundaries. The counter-mapping of journeys across administrative boundaries makes visible the need for a new acknowledgement of border-crossings – to accept the new knowledge – and to recognise and respond better to the tens of thousands of women and children affected.

Counter-mappings critique the dominant assumptions and make alternative understandings knowable – requiring alternative understandings and policy and practice responses.

You can watch the launch event, download a copy of Counter/Cartographies, and buy a print copy of the journal.


[1] Bowstead, Janet C. 2023. “The Spatial Churn of Women’s Domestic Violence Displacement.” You Are Here: The Journal of Creative Geography. Counter/Cartographies, no. 24: 92–95.

Women on the Move – report published

On Human Rights Day – 10th December 2021 – the report from this research was published.

Featuring more than 250 images by women who have been forced to relocate due to domestic violence, the book and maps provide an overview of the project, highlighting key research findings and new conceptualisations and knowledge from the research.

The publication presents the key messages – and points to further reading – on aspects of People, Places, Patterns and Processes of women and children on the move due to domestic violence and abuse.

To order a copy, please send postal address to info(Replace this parenthesis with the @ sign)womensjourneyscapes.net or send details via the contact form

Women on the Move – Vol. 1: Journeyscapes of Domestic Violence (book). ISBN: 978-1-7399686-0-1

Women on the Move: Journeyscapes of Domestic Violence. From Everywhere to Everywhere (map). ISBN: 978-1-7399686-1-8

Women on the Move: Journeyscapes of Domestic Violence. One Year of Spatial Churn (map). ISBN: 978-1-7399686-2-5

See the flier for further information.

The Scale of Services

Women and children forced to leave home due to domestic abuse need support and accommodation at the regional and national scale — not just the local scale. 

And they need more than just a temporary roof over their heads — they need the understanding and respect of specialist domestic violence support.  Such specialist support — of which women’s refuges are a key part — can never be taken for granted.

Refuges are under threat, not just from years of cuts to publicly-funded services, but from the very specific mismatch between the scale of funding and the scale of need.

Scale — in this case — is about geographical scale.

Women’s Refuges are still being planned and funded at the scale of local government; and yet it is primarily non-local women and children who need the refuge in any location.

The Domestic Abuse Bill proposes to keep this fundamental mismatch[1] — posing an existential threat to the future of women’s domestic violence refuges.

Local authorities are asked to assess the local need for accommodation services — without any recognition of the very different role of refuges compared to other accommodation services.  And then, as an afterthought, they will be asked to consider the need for cross-border support…

Does this mean their women — travelling elsewhere for support — or women from elsewhere coming into their area for support?  Or both?

Women’s strategy of relocating for safety shouldn’t be an afterthought.

This map shows just one year of women’s domestic violence journeys across borders to access formal services in England (so not any of the local services for local people)[2]:

One year of domestic violence journeys to services

What does all this cross-border travelling mean for any particular Local Authorities?

Let’s look at Brighton and Hove and East Sussex councils, which have just decided to stop funding their local specialist domestic violence organisation, Rise[3].

In one year, women and children come from different English regions and Scotland to access services in the two authorities.  But — and local authorities generally do not acknowledge this — more of their local women go elsewhere to access help.

One year of domestic violence journeys to services in Brighton & Hove and East Sussex
One year of domestic violence journeys from Brighton & Hove and East Sussex to services elsewhere

So Brighton & Hove and East Sussex need services in the rest of the country more than they actually support women and children from elsewhere.

Are councils really going to be able — or willing — to include all this in their needs assessments?

And — if they don’t — there isn’t going to be anywhere for women and children to go…


[1] https://www.gov.uk/government/publications/domestic-abuse-bill-2020-factsheets/local-authority-support-for-victims-of-domestic-abuse-and-their-children-within-safe-accommodation-factsheet

[2] Analysis by Janet C. Bowstead using data fromDepartment for Communities and Local Government and University of St Andrews, Centre for Housing Research (2012) Supporting People Client Records and Outcomes, 2003/04-2010/11: Special Licence Access [computer file]. Colchester, Essex, UK Data Archive [distributor]. Available from: http://dx.doi.org/10.5255/UKDA-SN-7020-1

[3] https://www.theargus.co.uk/news/19089879.rise-brighton-loses-13-million-seven-year-contract/

https://www.riseuk.org.uk/news/2021/latest-news-about-rises-funding


The complexity of women’s journeys

Services in a particular area of the country often do not realise the extent of women’s journeys as they try to escape domestic violence.

Survivors themselves may have very good reason to keep their location – and relocation – secret as they try to escape an abuser who knows so much about them.

It is only by combining data from services across the country – and safely de-identifying them – that we can see the complexity of women’s journeys across months and years; and possibly hundreds of miles.

An example from one woman shows multiple moves[1]:

At the start of the record of accessing services due to domestic violence, “Mia” was 17.  She was staying with friends in Essex, and over the next two and a half years travelled between four places in Essex, three in Northamptonshire, and one each in Hertfordshire and Cambridgeshire (all shown in red on the map), staying in refuges, Bed and Breakfast, private rented, hostel, supported housing and with friends.  All the moves added up to over 300 miles (straight line distances).   The final administrative record is a move to a women’s refuge in Lincolnshire – so still not to settled accommodation.


Another woman’s journey – with her son – shows fewer moves, but longer distances [1]:

At the start of the record of accessing services due to domestic violence, “Karen” was 45 with an 8 year old son.  They were in a refuge in Gateshead, so already on the move due to domestic violence; and over the next two and a half years travelled between three places in Essex and two in the North East (all shown in red on the map), staying in refuges and with family.  All the moves added up to around 950 miles (straight line distances).  The final administrative record is a move out of a refuge in Essex to a local authority tenancy in Newcastle upon Tyne.

It all shows that the snapshot that any service sees – in a particular area of the country – is often only a small fragment of the complexity of any woman’s domestic violence journey.

[1] Analysis by Janet C. Bowstead using data from Department for Communities and Local Government and University of St Andrews, Centre for Housing Research (2012) Supporting People Client Records and Outcomes, 2003/04-2010/11: Special Licence Access [computer file]. Colchester, Essex, UK Data Archive [distributor]. Available from: http://dx.doi.org/10.5255/UKDA-SN-7020-1 

Displaced by Human Rights violations

Violence against women is recognised internationally as a human rights violation:

“the elimination of violence against women in public and private life is a human rights obligation” – “this form of violence impedes the ability of women and girls to claim, realize and enjoy their human rights on an equal foot with men”[1]

And human rights violations are one of the recognised causes of displacement – whether internationally (leading to refugees) or within countries (leading to Internally Displaced Persons – IDPs).

The UN Office for the Coordination of Humanitarian Affairs publishes the “Guiding Principles on Internal Displacement”, highlighting the distinctive issues around internal displacement:

“Unlike refugees, the internally displaced have not left the country whose citizens they normally are.  As such, they remain entitled to the same rights that all other persons in their country enjoy.  They do, however, have special needs by virtue of their displacement.”[2]

The UNOCHA specifically lists human rights violations as one of the causes of internal displacement:

“The reasons for flight may vary and include armed conflict, situations of generalized violence, violations of human rights, and natural or human-made disasters.”  

So, it is clear that internal displacement due to violence against women is within these definitions.  That forced displacement of women and children due to domestic violence creates internally displaced persons (IDPs).

But, time and again, the focus of data and action on Internal Displacement is only on the other causes – armed conflict, generalised violence, natural or human-made disasters.

The Internal Displacement Monitoring Centre collects and maps data on displacement events – but the categories of the map are only Conflict, Disaster and Development.

The map for the last 30 days only shows events caused by Conflict or Disaster:

https://www.internal-displacement.org/

The map for the last 90 days also shows a few displacements caused by Development:

https://www.internal-displacement.org/

But there is no mapping here of human rights violations causing displacement.

The UK shows some Disaster displacement – and current news reports are full of people being forced from their homes due to flooding.  But there is no mention of the tens of thousands of women and children forced from their homes due to domestic violence – the tens of thousands of domestic violence IDPs in the UK.

[1] Office of the High Commissioner for Human Rights (UN Human Rights) https://www.ohchr.org/EN/Issues/Women/Pages/VaW.aspx

[2] Handbook for applying the Guiding Principles on Internal Displacement (UN Office for the Coordination of Humanitarian Affairs, 1999, p. 5) http://www.unhcr.org/en-us/protection/idps/50f94df59/handbook-applying-guiding-principles-internal-displacement-ocha-november.html

Who does what to whom?

There are many kinds of evidence and information that help us decide how to respond to domestic violence: how to prevent abuse – and the kinds of services to tackle perpetrators and support and empower survivors.

One important part of the evidence is the data that the Office for National Statistics (ONS) reports in November each year[1].  It often forms the basis of media articles around this time[2].

And it is around this time of year because of the International Day for the Elimination of Violence against Women (25th November)[3] – because domestic violence is predominantly gender-based violence – predominantly violence against women by men.

So it is vital in all our responses to domestic violence that we are clear about who does what to whom.

But here the data collection in England and Wales lets us down – Police Forces are still failing to produce the most basic data on whether victims and perpetrators are male or female.

If these are the data being used to make decisions on the seriousness of the issue and what should be done to tackle it, what does it say about priorities that only 28 out of 43 regional Police Forces in England and Wales can report the sex of the victim and the perpetrator[4]?

Police Forces producing adequate data in 2018 (coloured blue)


Police Forces producing adequate data in 2019 (coloured blue)

At this rate it will still be years until England and Wales has just the very basic evidence of “who does what to whom” in terms of domestic abuse reported to the Police.

[1]https://www.ons.gov.uk/peoplepopulationandcommunity/crimeandjustice/bulletins/domesticabuseinenglandandwalesoverview/november2019

[2] https://www.theguardian.com/society/2019/nov/25/domestic-abuse-charges-fall-despite-rise-in-recorded-crimes

https://www.dailymail.co.uk/news/article-7725361/Domestic-abuse-cases-rose-quarter-2018.html

[3] https://www.unwomen.org/en/what-we-do/ending-violence-against-women/take-action/16-days-of-activism

[4] A rise from 24 in 2018 https://www.ons.gov.uk/peoplepopulationandcommunity/crimeandjustice/bulletins/domesticabuseinenglandandwales/yearendingmarch2018  – but it is different Police Forces producing adequate data, with some which produced adequate data in 2018 failing to do so in 2019.

The churn of thousands of journeys

Most local authorities have around the same number of women arriving to access services because of domestic violence as the number of women who leave their area due to the abuse[1].  Authorities may not realise this, of course, as women (and their children) leave secretly – to reduce the risk from the abuser, they don’t tell the authorities when they leave, or where they are going.

Local authorities who provide domestic violence services – especially refuges or specialist accommodation services – tend to imagine a flow of women and children into their area from elsewhere.  They know nothing about their local women who escape violence and abuse by crossing boundaries – the women who leave.

It is only because of the service data for the whole of England (up to 2011) that we can see the wider picture[2].  And that is still only the picture of women and children who went to those particular types of housing services.

It is a striking picture – no strong flows between local authorities.  Not even strong flows into major cities, or along key public transport routes.

Animation to focus in on one year of women’s domestic violence journeys to services

It is a pattern of thousands of very individual journeys – including journeys from every single local authority in England.  It is a total churn of displacement – journeys probably far more complex than the straight lines on the map.  But even a flow map of one year of journeys[3] gives a sense of the disruption and upheaval for women and children seeking safety across the country.


[1] Bowstead, Janet C. 2015. “Forced Migration in the United Kingdom: Women’s Journeys to Escape Domestic Violence.” Transactions of the Institute of British Geographers 40 (3): 307–320. doi:10.1111/tran.12085.

[2] Department for Communities and Local Government and University of St Andrews, Centre for Housing Research (2012) Supporting People Client Records and Outcomes, 2003/04-2010/11: Special Licence Access [computer file]. Colchester, Essex, UK Data Archive [distributor]. Available from: <http://dx.doi.org/10.5255/UKDA-SN-7020-1>

[3] https://vimeo.com/369289835

The long and winding road

How many twists and turns do women have to make to escape abusive partners?

Only each woman herself would be able to map the road she has travelled – and often she still won’t know if there are more journeys to make.

Interviews with twenty women about their domestic violence journeys showed complex trajectories which could be over 2, 3, or more years; and involving nine or ten moves[1].  And women and their children could still be in temporary or insecure accommodation and anxious about when they would have to move again.

Analysis of the administrative data in this current research project[2] is revealing complex journeys of moves and stays – accessing different types of services across England.  It is only possible to link the data over a maximum of four years, and what is most striking is that these journeys seem to be just the tip of the iceberg. 

For example, a 22 year old woman, with no children, is recorded as having ten stays either in services or between accessing services; travelling over 600 miles within England in under 3 years.  But the first service record is in a women’s refuge – so she was already on the move due to domestic violence before this administrative record begins. 

A 39 year old woman, with a 3 year old daughter and a 1 year old son, was in a local authority tenancy at the start of the administrative record.  But over 800 miles later, in under year, she and her children had 7 stays in different types of accommodation, and the final recorded move is to stay with friends.  Even such complex trajectories are clearly only part of longer journeys away from abuse.

The administrative data only record what happened – we need to listen to women at every stage to understand which journeys are necessary, and which are more about a failure to provide the right support at that point in the road.


[1] Bowstead, Janet C. 2016. “Women on the Move: Theorising the Geographies of Domestic Violence Journeys in England.” Gender, Place and Culture 24 (1): 108–121. doi:10.1080/0966369X.2016.1251396.

[2] EUGEO. 2019. Re-Imagining Europe’s Future Society and Landscapes: EUGEO Congress 2019 Book of Abstracts. Galway, Ireland [Page 205] “Keep on running: women’s multiple moves in seeking security from domestic violence”. https://www.eugeo2019.eu/conference-schedule.

Data boundaries – Knowledge boundaries

Data are often collected within administrative boundaries, as if those boundaries contain all the necessary knowledge.  But boundaries can be porous – with people and resources crossing through.

Women escaping domestic violence are on the move – crossing administrative boundaries if they need to: either for safety, or support, or to find services.

However, if those services – and the authorities which plan and commission those services – only look within their administrative boundaries, they will not be able to see or understand what is going on.  They won’t have the data they need to provide good evidence for their decisions.

For example, if London services – whether at the Borough-level, or across the city – only collect London data, they will only get part of the picture.  They will see London women accessing London services; and they will see women from outside London coming to London domestic violence services.

But they are missing a key part of the picture.

Many London women escape domestic violence by leaving London.  They may go elsewhere in South East England; or may go much further.

In fact, for the period of time when there were country-wide data from the Supporting People Programme, every year more London women left to elsewhere in the country, than women came to London to access services.

The full data picture needs to cover all four aspects of the journeys women make:

  Within Borough journeys 

Within London journeys 

Journeys coming to London 

Journeys leaving London 

If authorities, service providers and commissioners only look at London data they only get a partial picture of London women and domestic violence services (http://www.domesticabusemigration.co.uk/).  They do not see all the London women who go to services elsewhere – that there are more women leaving London than coming to London.  That for domestic violence services London actually needs and uses the rest of the country more than it serves it.

* all maps one year of Supporting People Programme data – women accessing accommodation services due to domestic violence. Data based on Supporting People Client Records from Communities and Local Government. ©Janet  C. Bowstead